Deprivation
Page updated 03/02/2025
Jump to:
Background
Deprivation and poverty are related but slightly different.
- Deprivation - unmet needs caused by a lack of resources of all kinds
- The main measure is the 2019 Index of Multiple Deprivation (IMD 2019) from the Indices of Deprivation (IoD) suite.
- IoD is an area based measure, so people living within the area may have different experiences, although it describes the area as a whole and individuals will be influenced by the people and place around them.
- IoD is available for small areas (Lower Super Output Area, LSOA)
- Socioeconomic Status is the alternative individual measure.
- Poverty - lack of resources required to meet those needs
- Poverty is often measured using income, as low income is a significant aspect of poverty, and can be more easily compared consistently across countries. However there are other aspects of poverty.
- The UK's official poverty statistics come from the Housholds Below Average Income (HBAI) release. However this only goes down to region, there is no Bolton figure available from this.
- The main indicator is people who have a disposable household income (income after adding on benefits and taking off direct taxes) which is less than 60% of the average income, adjusted for the number of people in their household.
- See the sections below for more information on deprivation and poverty.
Deprivation
What is deprivation and how do we measure it?
The Indices of Deprivation (IoD) provides a set of relative measures of deprivation for small areas across England, based on seven different domains of deprivation. Each of the domains are constructed from a basket of different datasets or indicators. Combining information from the seven domains produces an overall relative measure of deprivation, the Index of Multiple Deprivation (IMD) which is the most widely used of the IoD. The domains can also be used seperately if that is a specific focus of work. IMD combines domains with the following weights.
The next issue of the Indices of deprivation has now been commissioned and is due late 2025.
There are substantial health inequalities between people from different deprivation groups, which you can explore more at https://fingertips.phe.org.uk/profile/inequality-tools. The IoD is an area based measure, so not every person in an area will experience deprivation to precisely the same extent - see also socioeconomic status.

Deprivation domains
- All deprivation domains are mapped in the 'Integrated care Neighbourhood tool' linked off the neighbourhoods page of this website.
- Income domain - adults/ families in receipt of a range of income related benefits (Income support, income based jobseekers' allowance, income based employment and support allowance, pension credit, asylum seeksrs receiving subsistence and/or accommodation support, universal credit without 'working - no requirements')
- Employment domain - in receipt of a range of benefits to support employment or where personal circumstances make working challenging (Jobseeker's allowance, employment and support allowance, incapacity benefit, severe disablement allowance, carer's allowance, universal credit 'searching for work' and 'no work requirements' groups
- Education, skills and training domain
- Children and young people subdomain - key stage 2 and 4 attainment, secondary school absence, staying on in education, entry to higher education
- Adults subdomain - no / low qualifications, English language proficiency
- Health and disability domain - years of potential life lost, comparative illness and disability ratio, acute morbidity, mood and anxiety disorders
- Barriers to housing and services domain
- Geographical barriers subdomain - Road distance to a post office; Road distance to a primary school; Road distance to a general store or supermarket; Road distance to a GP surgery
- Wider barriers subdomain - household overcrowding, homelessness, housing affordability
- Crime domain - recorded crime rates for violence, burglary, theft, criminal damage
- Living environment domain
- Indoor subdomain - no central heating, housing in poor condition
- Outoor subdomain - air quality; road traffic collisions involving injury to cyclists/ pedestrians
- Income deprivation affecting children index
- Income deprivation affecting older people index
As far as is possible, each indicator is based on data from the most recent time point available. The latest IoD release was in 2019, so the datasets used were from up to 2016/17. Because of the rollout of Universal Credit which particularly affected indicators in the Income Deprivation and the Employment Deprivation domains, the data for these domains relates to the tax year 2015/16.
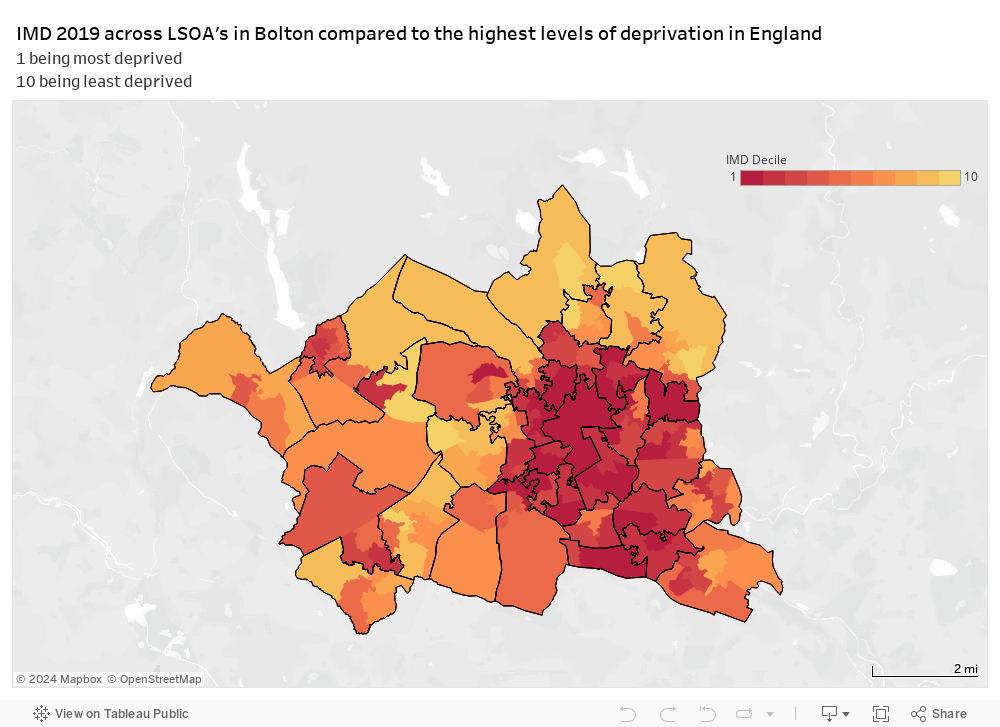
The Bolton picture
IMD is calculated for small areas (Lower Super Output Areas - LSOAs). Every LSOA in England is ranked from most deprived (ranked 1) to least deprived. It is common to describe how relatively deprived a small area is by saying whether it falls among the most deprived 10% or 20% of small areas in England (although there is no definitive cut-off at which an area is described as ‘deprived’).
Using mid 2022 LSOA population estimates:
- 26% of the Bolton population live in an area that is among the 10% most deprived nationally
- 45% of the Bolton population live in an area that is among the 20% most deprived nationally.
- 4% of the Bolton population live in an area that is among the 10% least deprived nationally
- 12% of the Bolton population live in an area that is among the 20% least deprived nationally.
There are a number of ways of combining LSOAs to larger geographies such as local authority areas. Here we have used the 'rank of average scores'. We have used it over the also often used ‘rank of average ranks’ because scores can spread out more than ranks and more deprived LSOAs tend to have more ‘extreme’ scores than ranks. So highly deprived areas will not tend to average out as much as when using ranks, which may 'flatten' differences more. Because Bolton has many deprived areas, we want to be able to look at it carefully.
- A rank of 1 is the most deprived
- Within Greater Manchester, Bolton is around average for the conurbation. Manchester is the most deprived borough, and Trafford the least.
- Deprivation is a relative measure so can't be compared directly over time, only in comparison to other areas. A reduction may not necessarily mean things have got worse in real life, they may just not have improved at the same rate as other areas around them
- Throughout the IMD series (2010, 2015, 2019), Bolton has remained in the second most deprived 10% of local authority areas in England. In IMD 2019, Bolton was ranked the 34th most deprived local authority in the country out of 317.
Since IMD 2010 there have been few changes regarding our most deprived neighbourhoods and deprivation remains at its greatest in parts of Halliwell, Crompton, Breightmet, Great Lever, Rumworth, and Farnworth, with pockets outside the town centre identifying Johnson Fold and Washacre
Explore more
There are a number of interactive tools to explore IMD. Here are some of those we’ve found most useful.
- Dashboard by Concentra
- Interactive maps by the Consumer Data Research Centre
- Interactive maps from Mapping GM including deprivation and many boundary types and other datasets that can be overlaid
- Dashboard by Trafford data lab
- Deprivation in Bolton - overview briefing
- GMCA briefing on the Indices of Deprivation 2019
- All data and documents relating to the English Indices of Deprivation from the Ministry of Housing Communities and Local Government
- Mapping resources, interactive tools and Open Data facilities to aid user’s exploration of the English indices of deprivation 2019 from the Ministry of Housing Communities and Local Government.
- LSOA population estimates from ONS for matching with deprivation
- Lookup comparing IMD 2015 & 2019 using 2021 LSOAs
- The postcode lookup in the Neighbourhoods Data Hub includes deprivation decile for each Bolton postcode ('imd decile')
Poverty & cost of living
Poverty is typically defined in terms of disposable household income (income after adding on benefits and deducting direct taxes), adjusted for the number of people in the household. Although low income is a significant aspect of poverty, there are other aspects of poverty too.
The UK's official poverty statistics are provided by the Housholds Below Average Income (HBAI) release however this only goes down to region level, there is no Bolton figure available from this. Two commonly used measures of poverty based on disposable income are given below. Median income is the point at which half of households have lower income and half have higher income. Income can be measured before or after housing costs are deducted.
- Relative low income - people living in households with income below 60% of the median in that year.
- Absolute low income - people living in households with income below 60% of median income in a base year, usually 2010/11. This measurement is adjusted for inflation.
HBAI also includes measures of ‘material deprivation’, which provide an indication of peoples’ ability to access or afford a range of everyday goods and services. Statistics are also included on household food security, which measure the percentage of households considered to have access to sufficient, varied food to facilitate an active and healthy lifestyle.
The Bolton picture
- Bolton tackling poverty strategy
- Greater Manchester Poverty Monitor
- North West poverty monitor
- GMCA cost of living dashboard
- Small area income data:
- Small area income estimates - from ONS (the official measure of small area income)
- Admin based small area income estimates - experimental statistics from ONS. Not the official measure but may be of use as they give income percentiles rather than one overall figure per area which could help to identify where people may be on lower incomes in areas of affluence
Specific types of poverty
- Child poverty:
- Child poverty - child poverty levels from the End Child Poverty Coalition, together with the Centre for Research in Social Policy at Loughborough University. Includes Bolton and parliamentary constituancy figures. For 2022-23, 45% of Bolton children (33,000 individuals) live in poverty. This puts Bolton 12th highest local authority (out of 361) in the country.
- Children in low income families - local area statistics from the ONS. In 2021, 32% of Bolton children (19,539 individuals) live in relative low-income households. This puts Bolton 13th highest (out of 374) in the country.
- Sub regional fuel poverty - Official statistics from the Department of Energy Security and Net Zero. Includes Bolton figure.
- Transport poverty - report from the Social Market Foundation. Includes Bolton figure.
- Food poverty
- Food poverty briefing - from the House of Commons Library
- Food insecurity – what can local government do? Briefing from The Health Foundation
Other useful resources
- Poverty in the UK - briefings from the House of Commons Library
- UK poverty 2024 - from Joseph Rowntree Foundation
- Households below average income - from the ONS. These statistics are the UK’s official source of poverty estimates, but only go down to region level
- Measuring poverty 2020 - from the Social Metrics Commission. The report uses the most recent data available to provide a comprehensive account of poverty based on the Commission’s measurement framework
- ONS cost of living collection